End-to-end commercial capability
Opalus turns opportunities into market-ready businesses through strategy, design, demand generation and operating support.
$340M+ THIRD-PARTY REAL ESTATE


This isn't a concept deck. The connected experience already exists built and funded by the founder.


Founding Customer Commitment
OVER A$300M of INNOVA projects in delivery


Metropolis team onsite · INNOVA Shailer Park · July 2026
“Opalus has been central to the success of the
INNOVA brand, providing end-to-end project support with a strong focus on market positioning, marketing, sales and contract administration. Across two developments representing A$110 million in project value, INNOVA Rochedale was fully sold at completion; after one subsequent sale fell through, only one of its 52 warehouse and café premises remains available. INNOVA Shailer Park is already more than 95% unconditionally sold with construction underway. Working together has also highlighted the complexity created by disconnected systems across a multi-company group. Having reviewed the OPAL prototype, I can see how it brings those functions into one connected platform. It is exactly what our business needs, and we are committed to migrating to OPAL.”

01 — Why OPAL Exists
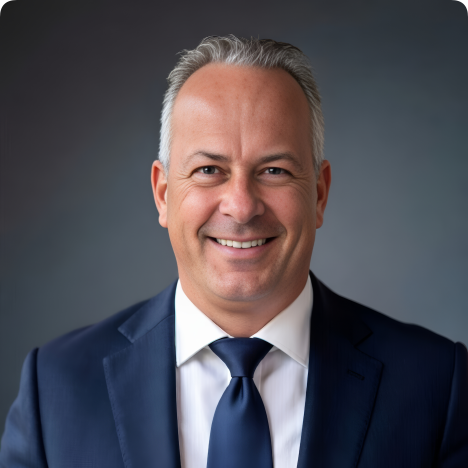

I began my career developing software for complex business operations, then spent three decades building businesses and using technology to improve how they run.

Accounting, CRM, HR, documents, marketing workflows and AI were spread across disconnected applications, spreadsheets and manual workarounds.

When a legacy accounting product was withdrawn, it exposed the wider issue: replacing the ledger alone would still leave the business fragmented.

Accounting at the core, with the rest of the business connected.
Founder-market fit isn’t the pitch. It’s the origin.
02 — The Problem
Accounting, CRM, HR, recruitment, documents and workflow live in separate systems that were never designed to talk.

Owners can't see finance, people, customers and workflow in one place. Accountants see the numbers, not the operating context.

Accounting, CRM, HR, recruitment, job costing, documents, workflow and reporting are fragmented across separate systems.

Every tool holds its own copy of the truth. Reporting means exporting, reconciling and manually rebuilding it in spreadsheets every single time.
03 — The Solution
Accounting remains the source of truth while every operating function shares one connected record.

Traditional accounting
system
Records the ledger
- Sales, purchases, banking
and financial reporting
- Add-ons and manual
connections for the rest of
the business
Connects the business
- Accounting, CRM, projects, people,
documents and workflow
- One permissioned AI layer across
the connected record
- Multi-company visibility, approvals
and audit trails
One system. One record.
One operating view.
04 — Why Now
Forced cloud migration creates the replacement moment; connected AI raises the standard for what comes next.
Legacy desktop accounting products are being withdrawn or moved to cloud-only subscriptions, forcing SMEs to choose a new system whether they planned to or not.
AI is being added to individual applications, but the business remains fragmented.
OPAL applies one permissioned AI layer across finance, customers, people, projects, documents and workflow.
Every forced migration creates an opportunity to replace more than the ledger.
One connected operating record makes cross-business intelligence possible.
05 — AI & Automation — With Control
OPAL connects finance, customers, people, projects, documents and workflow, then turns what it finds into useful, controlled action.
Ask any authorised question across finance, banking, CRM, HR, recruitment, projects, documents and workflow, and receive one source-linked answer.
ONE QUESTION → ONE CONNECTED OPERATING VIEWMonitor authorised mailboxes, extract invoice data, match suppliers and purchase orders, and prepare approval-ready drafts.
Match bank activity, surface exceptions and explain what remains unresolved, without rebuilding the story in spreadsheets.
Flag duplicates, changed bank details, overdue approvals and unusual movements before they disrupt the business.
Surface cash, pipeline, people and operational trends — with forecasts and management commentary in context.
06 — Market Opportunity
A bottom-up addressable universe aligned to a credible expansion path.
Approximately 83.2M businesses across Australia, New Zealand, the UK, US, Canada and EU-27.
50.3M businesses across83.2M businesses across Australia, New Zealand, the UK, US and Canada × US$335 = US$16.9B per year.
15,668 average billable customers across five live markets, producing US$35.25M net revenue after discounts and promotions.
Year-end scale: 20,145 customers · US$45.72M exit ARR · 20,145 customers · 0.0400%customer penetration of SAM.
*Illustrative revenue proxy: US$335 per business per year, consistent with the current deck. TAM combines the five planned markets and EU-27, including CEE; national business definitions differ. Sources: US SBA, Statistics Canada, UK DBT, ABS, Stats NZ and Eurostat. SOM: OPAL Financial Model v8.0. Net revenue is after discounts promotions; exit ARR is Month-60 net billed MRR ×12.
07 — Product Evidence
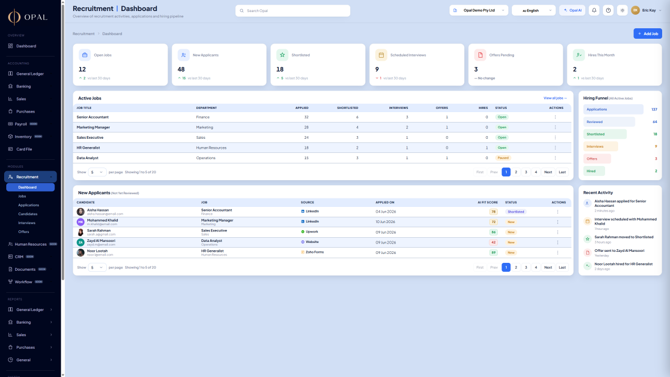
This isn't a concept deck. The connected experience already exists — built and funded by the founder.

Revenue, cash flow and key balances in one dashboard
Connected to the ledger, not bolted on
The module Opalus and its related parties needed first
Pipeline and customers in the same system as the money
Foundation Release — in build
Production database, authentication & permissions
Audit trails, reporting & payroll completion
Security hardening & full testing
Independent accounting validation
Chief Enterprise Architect hired · engineering build now staffed.
08 — Market Precedent
Xero entered an incumbent accounting market with a better delivery and distribution model. It did not invent accounting.
 ASX: XRO
JUL 2026A$74.34
JUN 2007A$0.90
ASX: XRO
JUL 2026A$74.34
JUN 2007A$0.90
Simplified endpoint trajectory, not a daily trading chart.
Precedent, not equivalence. Sources: Xero NZX IPO, Jun 2007; Xero FY08 Annual Report; Xero FY26 market release; ASX listing history and market data, Jul 2026.
The playbook — and where OPAL goes further
Xero changed how accounting software was delivered, distributed and adopted — cloud delivery, accountant-channel distribution, subscription economics. OPAL applies the same entry logic into the same market, then extends beyond accounting into the operating platform.
09 — Competitive Landscape
Accounting tools stop at the ledger. Operating suites run the business — but were built for the enterprise.
SME-native · whole business
Incumbents monetise partner marketplaces. Absorbing CRM, HR and workflow would cannibalise their own ecosystems.
Multi-company and intercompany were never designed in. Retrofitting a ledger core is a rebuild, not a feature.
Incumbent AI summarises. OPAL is designed to prepare approved actions across the whole business — with an audit trail.
Incumbents are compared on accounting. OPAL is the operating platform.
10 — Business Model
Illustrative subscription tiers and blended-ARPU economics, benchmarked against incumbent accounting pricing.
Year 1 Australian launch pricing · AUD
A$0 /mo
per entity
A$0 /mo
per entity
A$0 /mo
per entity
Prices shown in AUD (Year 1 Australian launch). The financial model runs these in US$ — Starter ≈US$17.58 · Growth ≈US$62.57 · Group ≈US$125.84 per month — as the capital raise is denominated in US$.
11 — Go-to-Market
Both channels run on the founder's in-house digital marketing operation — active since 2016 — rather than outsourced agencies.
Trust-led
SMEs rely on advisers for accounting-system decisions. Targeted acquisition of accountants, commission-based referral, practice-led client migration and partner certification.
Demo-led
Reach owners directly with the operating-platform story — demo-led outbound, founder-led sales, case studies and referral loops. Modelled separately from the partner channel.

Accounting-core entry

Modules switch on as needed

Seats & entities grow with the group

Adviser-channel distribution
12 — Meet the Team

Founder / CEO
Founder and operator with 30+ years across technology, marketing, advisory and property. Began in software development, including as an early developer at a company that later became a multibillion-dollar ASX-listed business; has since built and exited businesses across multiple sectors.
30+ yrs operator · software foundation · multiple exits · US$500K committed

CFO
Finance leader with 12 years of experience across KPMG audit, group consolidation and ERP platforms including SAP, Oracle and Hyperion. Brings hands-on experience in financial reporting, automation and control design to OPAL.
KPMG audit · ERP consolidation · FMVA® certified

Project Director
Programme and strategy leader, with experience across PwC, HDFC Bank and Embassy Group. Supports OPAL’s delivery planning, budgeting, risk coordination and cross-functional execution.
Programme delivery · Budgeting & risk · Cross-team leadership

Chief Enterprise Architect
Enterprise architect and AI leader, 27+ years across banking, insurance and telecom (IBM, Capgemini, HSBC, ING, AXA). Leads OPAL's technical architecture — AI, data engineering and cybersecurity.
TOGAF & ArchiMate · AI & cloud · led 100+ seat teams
13 — Funding Milestones
Four operating gates lead to a targeted Month 15 seed close; a fifth preserves contingency runway through Month 18.
Chief Enterprise Architect appointed and lean approximately 20-person product and engineering delivery structure mobilised to complete the browser-based Foundation Release.
Accountant and adviser cohort validates the browser platform across Months 7–9; essential mobile approvals, alerts and capture enter beta.
Production web platform and iOS/Android companion apps support essential mobile workflows. Controlled Australian acquisition begins and the formal seed process opens.
Pre-seed cash runway supports operations through Month 18 if the targeted seed close takes longer. Following close, seed capital funds the validated GTM motion, repeatable growth and staged four-market expansion.
Illustrative milestone framework. PMF metric to be agreed; customer, ARR and retention targets must match the revised financial model. Repeatable growth and four-market pilots move out of the funded window into the seed-funded phase.
14 — The Raise
A 12-month runway to prove product-market fit, with seed targeted to close at Month 15.
US$1.5M
Pre-seed round
Funds validation, Australian launch and product-market fit.
Issuer
OPAL Enterprise Systems, Inc.
Delaware corporation
Founder capital committed. Chief Enterprise Architect appointed. Lean ~20-person delivery structure defined and funded through Foundation Release.
Pre-seed runway from Month 7 through Month 18, with the seed targeted to close at Month 15.
Primary capital retained by the company and deployed into product validation, Australian launch and product-market-fit evidence.
Foundation Release
Founder-funded
Australian Launch
Pre-seed funded
Controlled Go-To-Market
Pre-seed funded
Product-Market-Fit Evidence
Supports target Month 15 close
Any investment will be made solely in OPAL Enterprise Systems, Inc. and will be subject to definitive investment documents.
For and on behalf of
OPAL Enterprise Systems, Inc.
Delaware corporation
This presentation has been prepared by OPAL Enterprise Systems, Inc., a Delaware corporation (the “Company”), solely for confidential preliminary discussions with prospective investors concerning a proposed investment in the Company. It does not constitute an offer to sell or a solicitation of an offer to purchase securities. Any offer, if made, will be made only by the Company under definitive investment documents, to eligible investors and only where legally permitted.
Any investment will be solely in the Company; no securities are offered in Opalus Investments or any other entity. Metropolis Development Group is an independent third-party customer and is not an affiliate or related entity of either the Company or Opalus Investments.
Eric Kay presents this opportunity solely in his capacity as Founder and CEO and authorised representative of the Company. He receives no commission, success fee or other transaction-based compensation in connection with the proposed investment.
This presentation contains projections, estimates and forward-looking statements involving risks and uncertainties. Actual results may differ materially. Prospective investors should conduct their own due diligence and obtain their own legal, tax and financial advice.
A 12-month runway to prove product-market fit, with seed targeted to close at Month 15.